
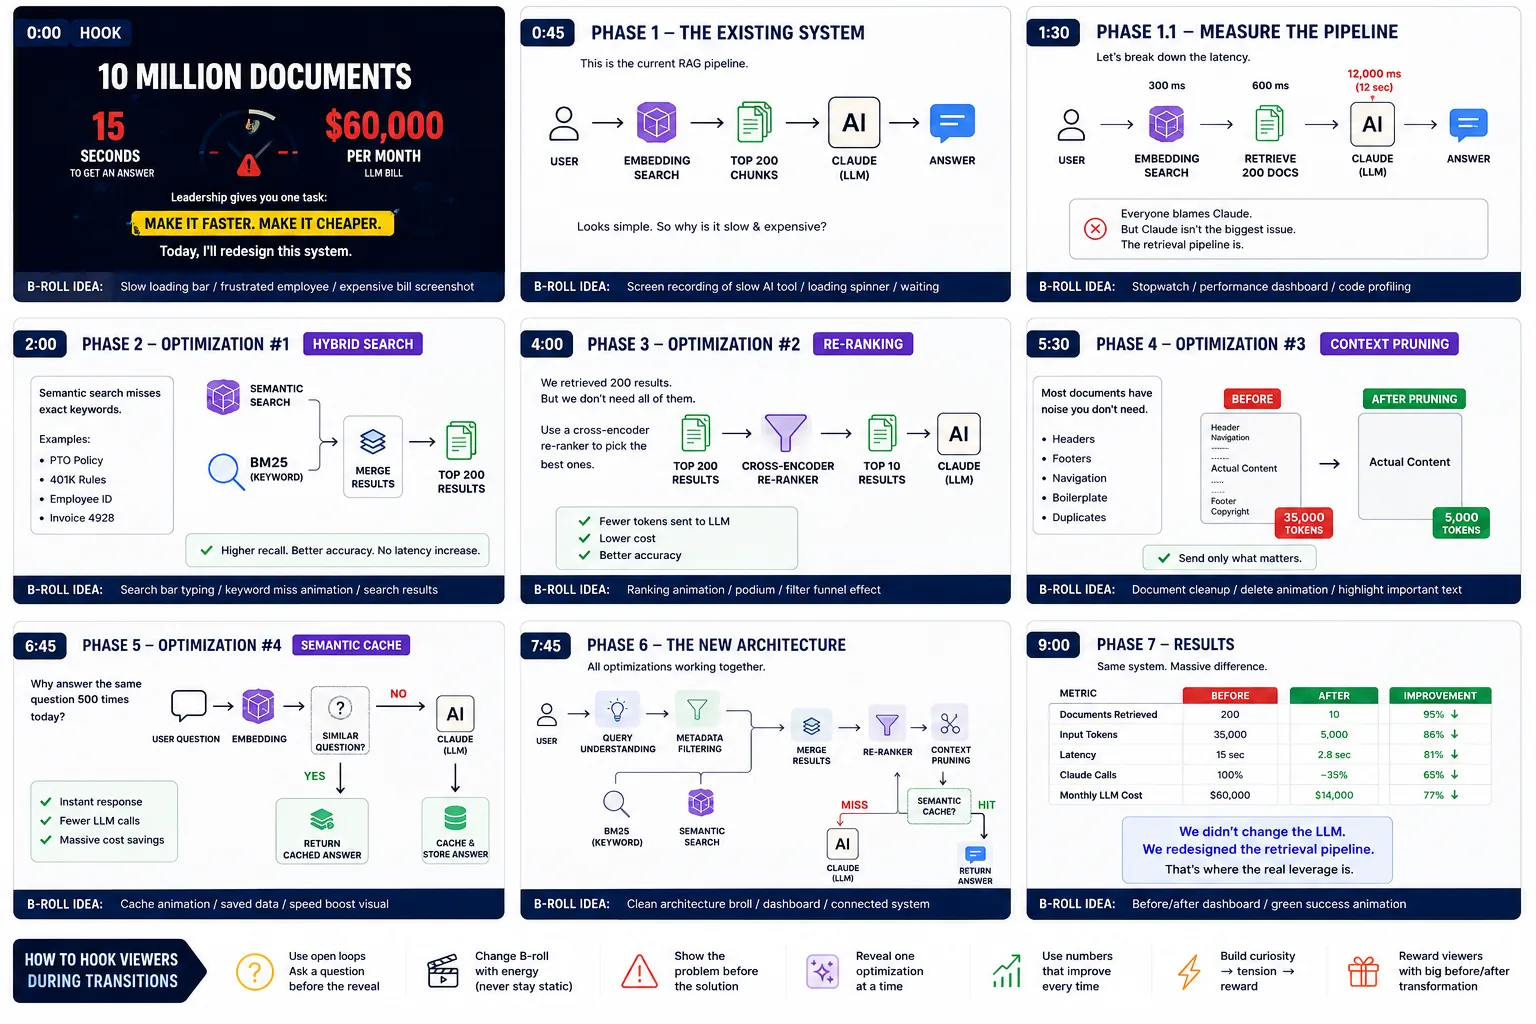
This is a behind-the-scenes storyboard for the enterprise RAG video — a phase-by-phase plan of the teardown, with B-roll ideas and viewer-retention hooks. It shows how the educational content itself is produced.
In simple terms
The production storyboard for the RAG optimization video — phases, visuals and retention hooks.
How it works
- 1Hook: open with a striking stat (10 million documents, 15s and $60K/month) and a promise to redesign it.
- 2Phase 1–2: show the existing slow, expensive RAG pipeline, then optimization #1 (hybrid search).
- 3Phase 3–5: optimization #2 (re-ranking), #3 (context pruning), #4 (semantic cache).
- 4Phase 6–7: the new combined architecture and the results (before/after metrics).
- 5Throughout: B-roll ideas and transition hooks keep viewers watching.
Key points
- How to hook viewers: open loops, change B-roll, show the problem before the solution.
- Reveal one optimization at a time and use numbers every time.
- Reward viewers with a big before/after transformation.
- This is a content-production plan, not an AI concept — included for completeness.
Why it matters
This card pulls back the curtain on how the explainer videos are structured for clarity and retention — useful if you create educational content yourself.
Frequently asked questions
- Is this an AI concept?
- No — it's a behind-the-scenes storyboard for producing the RAG video, included for completeness.
- What's the takeaway?
- Structure explainers as a hook plus one-optimization-at-a-time reveals, backed by concrete before/after numbers.