
9 · Observability & Monitoring
Tracing, metrics and logs across the agent stack.
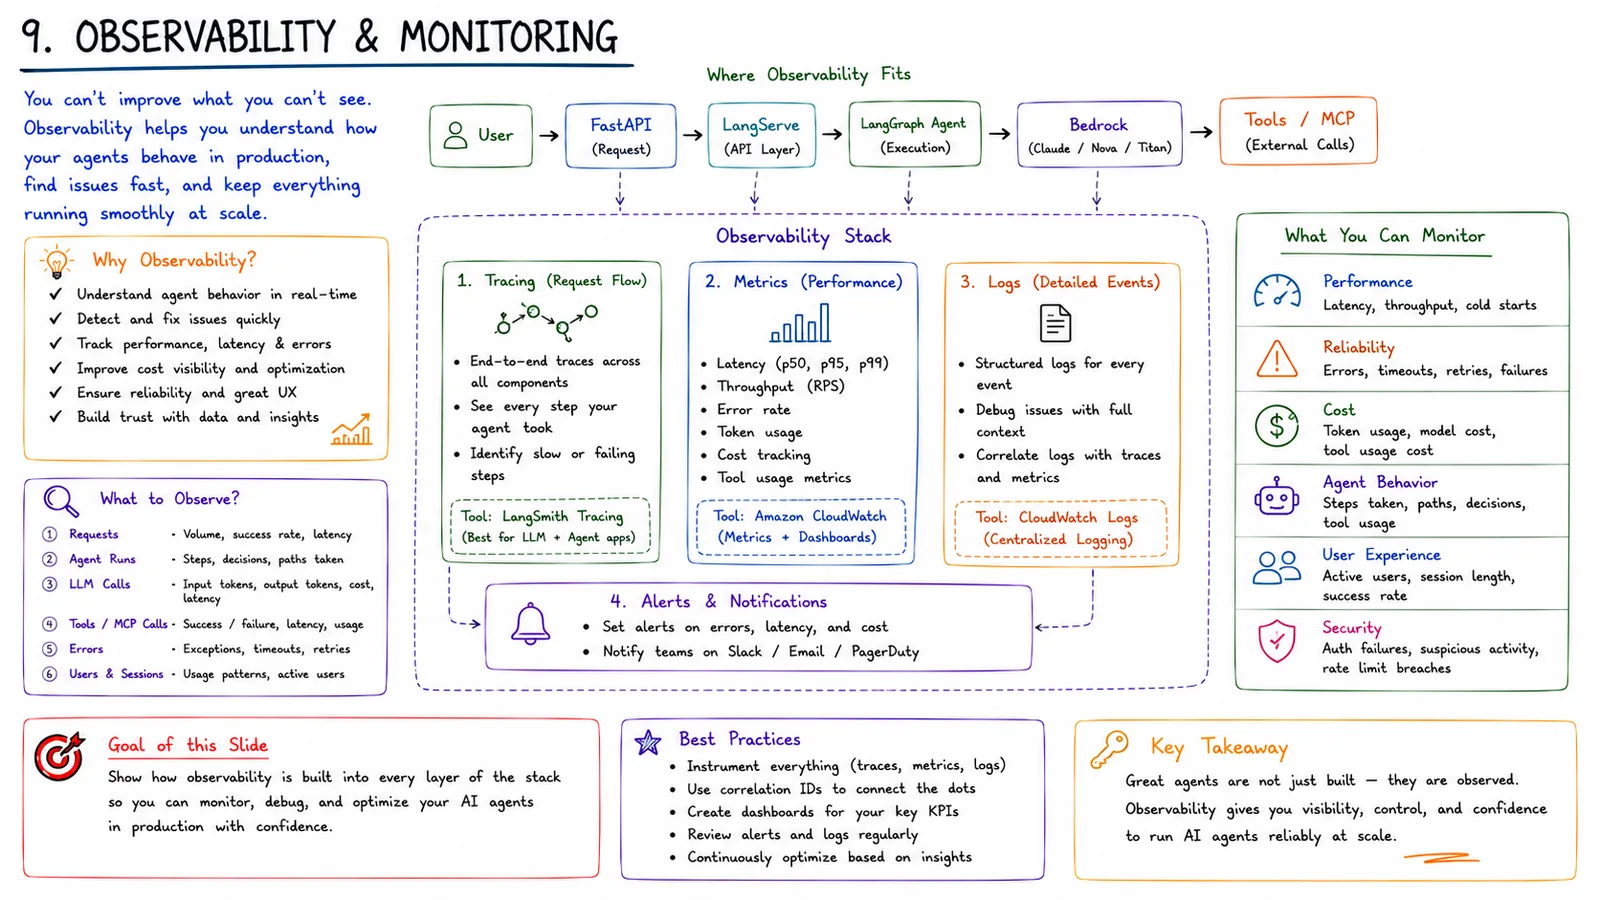
You can't improve what you can't see. Observability helps you understand how agents behave in production, find issues fast and keep everything running smoothly at scale.
In simple terms
Tracing, metrics and logs across the whole agent stack so you can debug and improve it.
How it works
- 1Tracing (request flow): end-to-end traces across all components.
- 2Metrics (performance): latency, throughput, error rate, token and cost tracking.
- 3Logs (detailed events): structured logs to debug with full context.
- 4Alerts & notifications: set alerts on errors, latency and cost.
Key points
- Observe requests, agent runs, LLM calls, tools, errors and users/sessions.
- LangSmith is best for LLM/agent traces; CloudWatch for infra metrics and centralized logs.
- Instrument everything and use correlation IDs to connect the dots.
- Great agents aren't just built — they're observed.
Why it matters
In production, things fail in unexpected ways. Observability gives the visibility, control and confidence to run AI agents reliably and cost-effectively at scale.
Frequently asked questions
- What should I monitor?
- Latency, throughput, error rates, token cost, tool success and agent behaviour, plus user sessions.
- Which tools?
- LangSmith for LLM/agent tracing and Amazon CloudWatch for metrics, dashboards and centralized logs.
More in Production AI Stack (2026)
1 · The Big Picture
The complete end-to-end production AI stack (2026).
2 · User Request Lifecycle
How one request flows through the whole system.
3 · LangChain Ecosystem
How LangChain, LangGraph, LangServe and LangSmith fit together.
4 · LangGraph Orchestration
Stateful, multi-step agent workflows.
5 · AWS Bedrock Integration
How LangChain talks to models through Amazon Bedrock.
6 · Amazon AgentCore
The enterprise runtime for LangChain/LangGraph agents.